A couple of weeks ago, we set the stage for developing evidence-based, data-driven answers to questions about learning loss resulting from COVID-19 related school closures. We have now analyzed 27 existing datasets from low and middle income countries (LMICs) to estimate year-on-year growth in student reading achievement under normal conditions, as a starting point for developing models to estimate learning losses (relative to expected growth). Since learning loss will not be equal for all students, we focus on examining full distributions of scores in order to produce more precise estimates than could be obtained by relying only on average change. These analyses have yielded promising evidence of common trends across countries, grades, and languages—leading us toward a new model of estimating loss.
How the model works
We began by examining distributions of oral reading fluency scores from students in consecutive grades (e.g. grade 1 and grade 2; grade 2 and grade 3). The idea is that grade 3 scores are our best prediction of where grade 2 students will be after one year of schooling. Therefore, we can use this approach to model a full year’s learning gain or conversely an expected loss caused by school closures and disruptions. An example from the Philippines is displayed in Figure 1.
Figure 1: Cumulative distribution of oral reading fluency scores for grade 2 and grade 3 students (Philippines 2019 - Maranao)

In this example, it can clearly be seen that the grade 2 (blue line) and grade 3 (red line) are nearly parallel between the two vertical lines (at the 25th and 95th percentiles) but follow different shapes in the ‘tails’. In other words, grade 3 students in the middle of the distribution were consistently reading about 20 words per minute faster than their grade 2 counterparts at the same point in the distribution. Therefore, a simplified approach to predicting annual learning gains for grade 2 students only requires adding a constant 20-word increment for nearly three quarters of the presumed population. Learning losses for this group can therefore also be estimated as a constant (relative to the percent of schooling lost). However, those students in the bottom tail of the distribution (with less secure reading skills from the start) will likely be more impacted by the lack of access to regular reading practice, while those at the top end are expected to suffer smaller losses. This serves as the basis of our model for estimating learning loss across an entire distribution of students and will enable us to highlight the inequitable impacts of school closures.
Trends across countries, grades, and languages
Our 27 datasets varied by country, grade, language, and/or year of data collection. With the exception of one dataset from Liberia (2013), we found a striking level of consistency with this pattern: ‘constant’ differences in middle of the distribution, with varying relationships in the tails. The following figures shed light on some of the nuances that we discovered in this work.
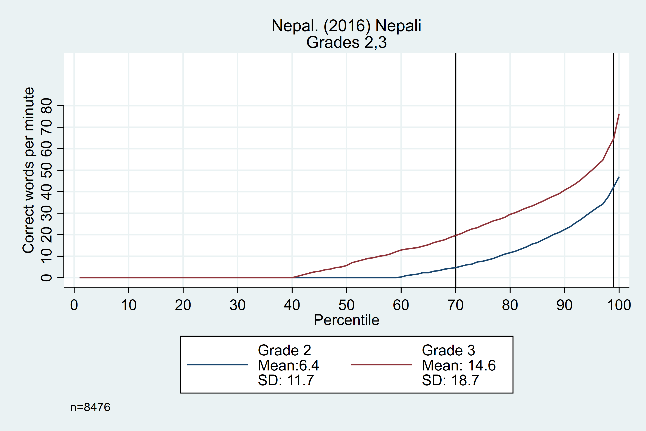
Figure 2 points to evidence that the size of the ‘middle’ (relative to the tails) can change significantly based in large part on the proportion of zero scores for a given population. In the left-hand graph from El Salvador, we see a constant difference from the 25th to 95th percentiles, while in Nepal the ‘middle’ only consists of the 70th to the 98th percentile.
Figure 2: Oral reading fluency score distributions for El Salvador and Nepal, by grade

The trends across grades, years, and languages are displayed in Figure 3. Results in the top row from Tanzania show evidence that the constant difference is not grade-specific, showing similar distributions from grade 1 to grade 2, grade 2 to grade 3, and grade 3 to grade 4 (though the width of the ‘middle’ section does increase as students get older). The bottom row shows data from the Philippines, with consistent trends across years (2014 and 2015) and languages (Cebuano and Ilokano).
Figure 3: Oral reading fluency score distributions for Tanzania and Philippines, by grade, year, and language


Interestingly, this trend was not quite as consistent for the three datasets we analyzed with Arabic-speaking students. As shown in the following example from the West Bank (Figure 4), the gap between grades appears to widen as the percentiles increase.
Figure 4: Oral reading fluency score distributions for West Bank, by grade

Implications for estimating learning loss
For nearly all of the datasets we examined, differences between students’ oral reading fluency scores at given percentiles in consecutive grades were constant throughout the ‘middle’ of these distributions. While our initial approach was to estimate the ‘middle’ range based on visual fit, we are currently working to develop an approach that can be consistently applied across datasets. For example, instead of using percentiles, it may be more appropriate to use oral reading fluency scores as cut points for lower and upper thresholds. Having a consistent model for estimating the ‘middle’ section with best fit across datasets will ultimately allow us to provide more universally-applicable guidance for estimating gains and losses.
While calculations for estimating losses in the ‘middle’ are relatively straightforward (and constant) based on these analyses, there is still work to be done on modeling changes at the tails. For example, what would happen if we assumed that students in the top tail will continue to improve their reading skills at home (with parental support and access to distance learning), while students in the bottom tail will regress to the levels of learning obtained at the end of the prior year (since they have not built sufficient skills to even maintain initial progress)? We play this scenario out with an example from the Philippines in Figure 5. While a 30% learning loss (i.e. the equivalent of an approximately 3-month school closure) would yield a 5.9 correct word per minute (cwpm) loss for grade 3 students if applied to the average (i.e. 30% of the 19.8 cwpm expected gain), our model under these assumptions estimates a larger 9.2 cwpm loss (i.e. 55.6 minus 46.4).
Figure 5: Example scenario with 30% learning loss impact for grade 3 Maranao-speaking students in the Philippines

Ultimately, these analyses provide promising evidence about how to easily estimate expected year-on-year growth measures and conversely to estimate learning loss estimates (as proportions of a single year’s expected learning gain). Our next steps are now to develop a consistent approach for estimating losses for students at the ‘tails’ and to use analyses of summer learning loss to begin to predict expected losses for varying lengths of school closures across contexts.
Co-authored by Christopher Cummiskey and Jonathan Stern. Benefitted from input from Joe DeStefano, Tim Slade, and Ben Piper.
While we're fortunate to have a large number of datasets to explore, this work would be strengthened by us coming together as a community. We would love to know if those of you with relevant data are seeing similar trends to what we've seen here. We look forward to hearing from you (and please feel free to contact us if you have any questions or would like assistance in creating plots like the ones included in this blog).